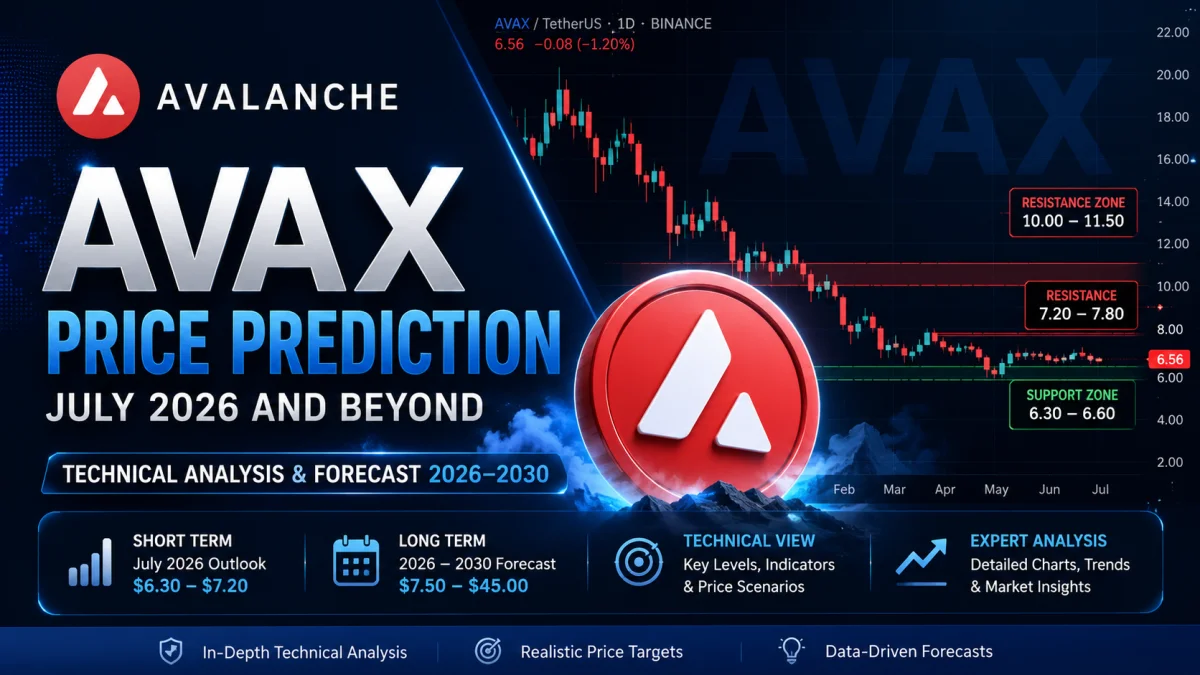
Looking for an updated AVAX price prediction? This in-depth analysis examines Avalanche's monthly, weekly, daily, and 4-hour charts to forecast potential price movements for July 2026 and beyond. Explore key support and resistance levels, technical indicators, and realistic price targets through 2030 to better understand Avalanche's short- and long-term outlook.

Looking for an updated AVAX price prediction? This in-depth analysis examines Avalanche's monthly, weekly, daily, and 4-hour charts to forecast potential price movements for July 2026 and beyond. Explore key support and resistance levels, technical indicators, and realistic price targets through 2030 to better understand Avalanche's short- and long-term outlook.
Avalanche (AVAX) remains one of the best-known Layer 1 blockchain projects, offering fast transactions, low fees, and support for decentralized applications (dApps), NFTs, and decentralized finance (DeFi). Since reaching its all-time high in 2021, AVAX has experienced multiple market cycles, moving through strong rallies as well as deep corrections.
Like most cryptocurrencies, Avalanche is heavily influenced by Bitcoin's trend, investor sentiment, network growth, and overall market liquidity. Because of this, AVAX can experience large price swings within short periods, making technical analysis an important tool for traders and investors.
In this article, we analyze Avalanche using four different timeframes—Monthly, Weekly, Daily, and 4-Hour—to understand both the long-term trend and the current market structure. We also provide a realistic AVAX price prediction for July 2026, short-term forecasts, and long-term expectations through 2030.
Rather than making unrealistic price targets, this analysis focuses on chart data, technical indicators, support and resistance levels, and market structure to help readers make informed decisions.
AVAX Price Today
Based on the latest charts provided for this analysis:
| Metric | Current Status |
|---|---|
| Current Price | $6.56 |
| Overall Trend | Strong Bearish |
| Market Structure | Mixed (Long-term Bearish, Short-term Improving) |
| Monthly RSI | 39.08 |
| Weekly RSI | 33.91 |
| Daily RSI | 46.67 |
| 4H RSI | 48.44 |
| Daily Signal | Strong Sell |
| Weekly Signal | Strong Sell |
| Monthly Signal | Strong Sell |
| Volatility | Normal |
| Volume | Low |
Although Avalanche has stabilized near the $6.50 support area, the broader trend remains bearish. Most higher-timeframe indicators still show weakness, while lower timeframes suggest the selling pressure has slowed.
This combination often creates a consolidation phase, where buyers and sellers compete before the market decides its next major direction.
AVAX Price Prediction Overview
| Time Period | Prediction | Confidence |
|---|---|---|
| Next 7 Days | Sideways to Slightly Bullish | Medium |
| July 2026 | $6.30 – $7.20 | Medium |
| Next 3 Months | $6.00 – $8.50 | Medium |
| End of 2026 | $7.50 – $11.50 | Medium |
| 2027 | $10 – $18 | Medium |
| 2028 | $14 – $25 | Medium |
| 2029 | $18 – $32 | Medium |
| 2030 | $25 – $45 | Medium-Low |
Note: These forecasts are based on current technical analysis and market conditions. Cryptocurrency prices can change rapidly due to macroeconomic events, regulations, investor sentiment, or major developments within the Avalanche ecosystem. These predictions are educational estimates and should not be considered financial advice.
What Is Avalanche (AVAX)?
Avalanche is a Layer 1 blockchain designed to provide fast, scalable, and low-cost transactions while supporting smart contracts and decentralized applications. It was created to solve common blockchain challenges such as slow transaction speeds, high fees, and network congestion.
Unlike many older blockchains, Avalanche uses a unique consensus mechanism that allows transactions to reach finality in just a few seconds. This makes it attractive for developers building decentralized finance (DeFi) platforms, NFT marketplaces, blockchain games, and enterprise applications.
The native cryptocurrency of the network is AVAX, which is used for:
- Paying transaction fees
- Staking to secure the network
- Participating in governance
- Supporting validators
- Transferring value across the Avalanche ecosystem
The long-term value of AVAX depends on several factors, including user adoption, developer activity, institutional interest, and overall growth in the cryptocurrency market.
Key Factors That Influence AVAX Price
Before diving into the technical analysis, it's important to understand what typically drives Avalanche's price movements.
1. Bitcoin's Market Direction
Bitcoin often sets the overall trend for the cryptocurrency market. When Bitcoin enters a strong uptrend, many altcoins—including AVAX—tend to follow. On the other hand, a sharp decline in Bitcoin can put pressure on Avalanche even if its own fundamentals remain strong.
2. Avalanche Network Adoption
An increase in decentralized applications, active wallets, total value locked (TVL), and on-chain transactions generally supports long-term demand for AVAX.
3. Institutional Interest
Partnerships with financial institutions, blockchain companies, or enterprise users can improve market confidence and attract new investors.
4. Token Supply and Staking
A significant portion of AVAX is locked through staking, reducing the circulating supply. If demand increases while supply remains limited, the price may benefit over time.
5. Global Economic Conditions
Interest rates, inflation, geopolitical events, and overall investor sentiment toward risk assets can influence cryptocurrency prices, including AVAX.
6. Market Sentiment
Fear and greed play a major role in crypto markets. Positive news, exchange listings, ecosystem upgrades, or broader bullish momentum can quickly improve investor confidence, while negative events may trigger increased selling pressure.
AVAX Monthly Technical Analysis
The monthly chart provides the clearest picture of Avalanche's long-term trend because each candle represents one month of trading activity. While short-term charts often contain market noise, the monthly timeframe highlights the broader direction followed by institutional investors and long-term holders.
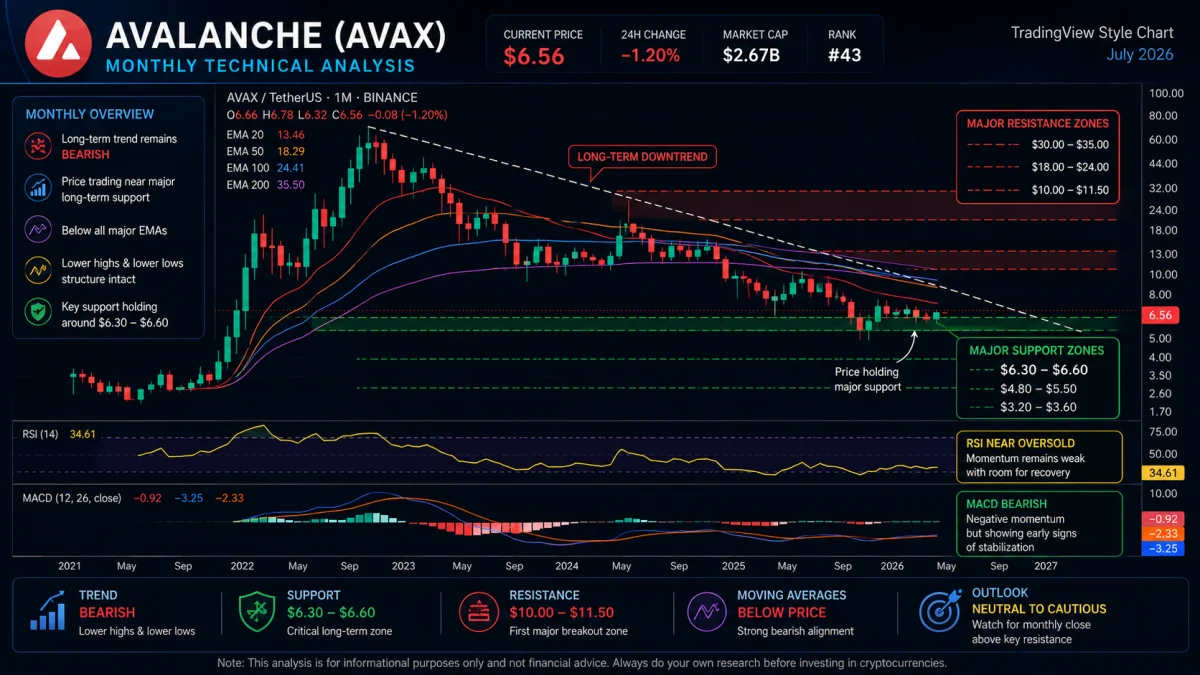
Based on the latest monthly chart, Avalanche remains in a long-term bearish trend, although the selling pressure has started to slow compared to previous months. Buyers are attempting to defend an important support zone around $6.20–$6.60, but the market has not yet produced enough evidence to confirm a full trend reversal.
At the time of analysis, AVAX is trading near $6.56, far below its previous cycle highs. This reflects how significantly the cryptocurrency has corrected since its bull market peak.
Monthly Trend Overview
| Indicator | Status | Interpretation |
|---|---|---|
| Trend | Bearish | Sellers remain in control |
| Market Structure | Bearish | Lower highs continue |
| Price vs EMA20 | Below | Short-term weakness |
| Price vs EMA50 | Below | Medium-term bearish |
| RSI | 39.08 | Weak but not oversold |
| MACD | Bearish | Momentum still favors sellers |
| Volume | Low | Limited buying interest |
| Volatility | Normal | Stable price swings |
The combination of these indicators suggests that AVAX is still in a corrective phase. However, the pace of the decline has slowed, which may indicate the market is entering an accumulation period rather than another sharp sell-off.
Long-Term Market Structure
One of the easiest ways to understand market direction is by looking at Higher Highs (HH) and Lower Highs (LH).
A healthy uptrend forms a sequence of:
- Higher Highs (HH)
- Higher Lows (HL)
A bearish trend forms:
- Lower Highs (LH)
- Lower Lows (LL)
Your monthly chart clearly shows that Avalanche continues to produce Lower Highs, confirming that sellers still dominate the long-term trend.
Although several small rebounds have occurred during the past few years, none has been strong enough to break the previous major swing highs. Until that changes, the overall market structure remains bearish.
This does not necessarily mean AVAX must continue falling. Instead, it means any recovery should currently be viewed as a rally within a larger downtrend unless the price reclaims key resistance levels.
EMA Analysis
Exponential Moving Averages (EMAs) help traders identify the direction and strength of a trend.
On the monthly timeframe:
| EMA | Value | Signal |
|---|---|---|
| EMA20 | 15.58 | Bearish |
| EMA50 | 22.82 | Strong Bearish |
| EMA100 | Not Yet Available | — |
| EMA200 | Not Yet Available | — |
The current AVAX price of approximately $6.56 sits well below both the 20-month and 50-month EMAs.
This is an important bearish signal because moving averages often act as dynamic resistance during long-term downtrends. Each attempt to rally may face selling pressure near these levels.
To improve the long-term outlook, Avalanche would first need to reclaim the 20-month EMA and then establish sustained trading above the 50-month EMA. Until that happens, the broader trend remains weak.
RSI Analysis
The Relative Strength Index (RSI) measures momentum on a scale from 0 to 100.
General interpretation:
- Above 70 = Overbought
- Below 30 = Oversold
- Around 50 = Neutral
The monthly RSI currently stands near 39.
This tells us several things:
- Momentum remains weak.
- Sellers still have the advantage.
- AVAX is not yet deeply oversold.
- There is room for recovery without the market becoming overheated.
A monthly RSI between 35 and 45 often appears during long accumulation phases, where large investors gradually build positions before a stronger trend develops.
However, RSI alone should never be used as a buy signal. It becomes more meaningful when confirmed by improving price structure and increasing trading volume.
MACD Analysis
The Moving Average Convergence Divergence (MACD) helps identify changes in momentum.
On the monthly chart, the MACD remains bearish, indicating that long-term momentum still favors sellers.
This does not necessarily mean AVAX will continue making new lows every month. Instead, it suggests buyers have not yet generated enough momentum to reverse the broader trend.
A bullish monthly MACD crossover would be one of the first technical signs that long-term momentum is beginning to improve.
Volume Analysis
Trading volume plays a key role in confirming market trends.
The current monthly chart shows low trading volume, which suggests:
- Institutional buying remains limited.
- Strong breakout confirmation is still missing.
- Investors may be waiting for a clearer market direction.
If AVAX begins rising while trading volume also increases, that combination would provide stronger evidence that buyers are returning to the market.
Until then, low volume makes it difficult to confirm the start of a sustainable bull trend.
Key Monthly Support Levels
Support levels are price zones where buying interest has historically increased.
Based on the monthly chart:
| Support Zone | Importance |
|---|---|
| $6.20–$6.60 | Immediate long-term support |
| $5.50–$5.80 | Secondary support if current level breaks |
| Below $5.00 | High-risk zone that could trigger stronger selling |
The current support around $6.20–$6.60 has become especially important because buyers have repeatedly defended this area.
Holding above this zone improves the chances of a gradual recovery, while a decisive monthly close below it could expose AVAX to additional downside.
Key Monthly Resistance Levels
Resistance levels are areas where sellers have historically entered the market.
| Resistance Zone | Importance |
|---|---|
| $8.50–$9.00 | First major resistance |
| $15–$16 | Near EMA20 resistance |
| $22–$23 | Near EMA50 resistance |
| Above $30 | Would indicate a major trend reversal |
Breaking above the first resistance zone around $8.50–$9.00 would be an encouraging sign, but the larger trend would remain bearish until AVAX can reclaim the long-term moving averages.
Bullish Scenario
For the long-term outlook to improve, several technical developments would strengthen the case for a recovery:
- Price continues holding above the $6.20–$6.60 support area.
- Monthly candles begin forming higher lows.
- RSI gradually rises toward 50, showing improving momentum.
- Trading volume increases during upward moves.
- AVAX closes above the 20-month EMA and later challenges the 50-month EMA.
If these conditions develop over the coming months, Avalanche could transition from a prolonged correction into the early stages of a new bullish cycle.
Bearish Scenario
The bearish outlook would strengthen if the following occur:
- Monthly support around $6.20 fails.
- Selling volume increases significantly.
- RSI falls below 30, indicating stronger downside momentum.
- Lower highs continue to form without any meaningful breakout.
In that case, AVAX could revisit lower support levels before attempting another long-term recovery.
Monthly Outlook Summary
The monthly chart suggests that Avalanche remains in a long-term bearish trend, but there are early signs that the market may be stabilizing near an important support zone. While momentum indicators have not yet confirmed a reversal, the slowing pace of the decline indicates that aggressive selling has eased compared to earlier stages of the downtrend.
For long-term investors, the key level to monitor is the $6.20–$6.60 support area. As long as this region continues to hold, the probability of a gradual recovery improves. However, a sustained move above the 20-month EMA, accompanied by stronger trading volume and a bullish shift in momentum indicators, will be needed before Avalanche can be considered to have entered a new long-term uptrend.
Next Phase: Weekly Technical Analysis, where we'll examine medium-term momentum, trend strength, EMA alignment, RSI and MACD signals, and identify the key levels that could determine AVAX's direction over the coming weeks.
AVAX Weekly Technical Analysis
While the monthly chart reveals the long-term direction, the weekly timeframe helps us understand the medium-term trend and whether buyers are beginning to regain control. Each weekly candle represents one week of trading, making this timeframe useful for identifying trend changes before they become visible on the monthly chart.
Based on the latest weekly chart, Avalanche is still trading in a strong bearish trend, but the recent price action suggests the market is trying to build a base above long-term support. Although sellers continue to dominate, the pace of the decline has slowed compared to previous months.
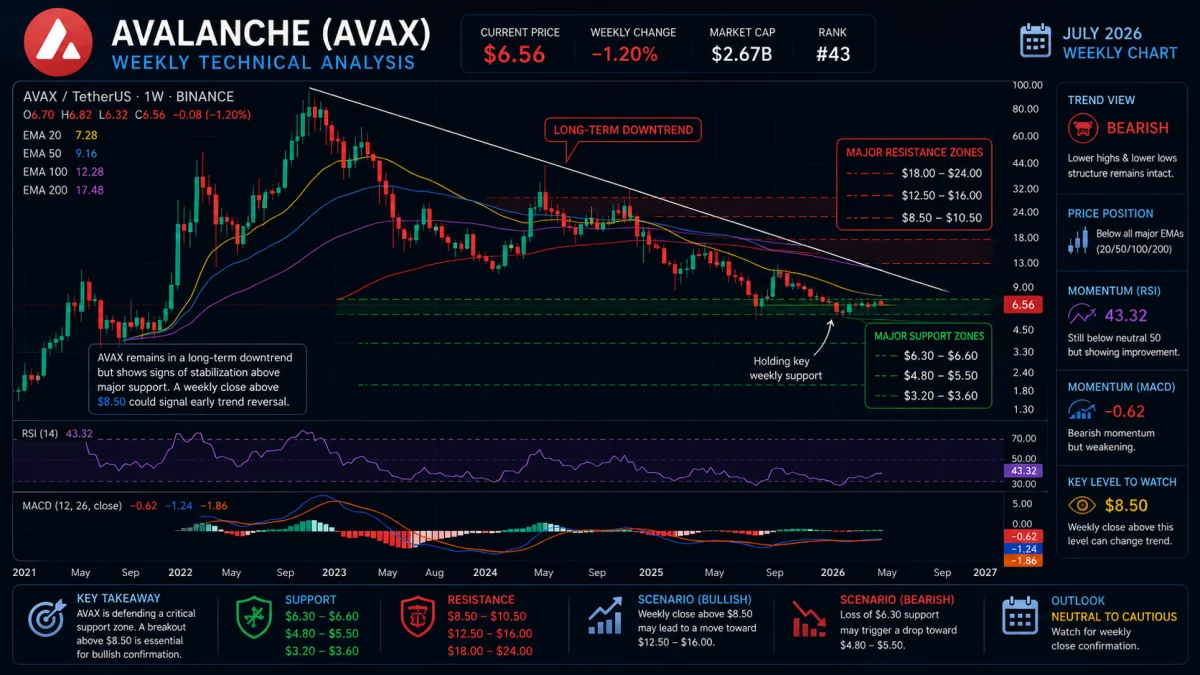
At the time of analysis, AVAX is trading near $6.56, with most major moving averages positioned above the current price, highlighting that buyers still face significant resistance.
Weekly Market Overview
| Indicator | Current Status | Interpretation |
|---|---|---|
| Current Price | $6.56 | Trading near major support |
| Trend | Strong Bearish | Sellers remain in control |
| Market Structure | Bearish | Lower highs continue |
| Weekly RSI | 33.91 | Weak momentum but close to oversold |
| MACD | Bullish | Early improvement in momentum |
| Volume | Low | Buying pressure remains limited |
| Volatility | Normal | Stable price movement |
Although the overall trend remains bearish, the bullish MACD on the weekly chart is an encouraging sign. It suggests that downside momentum is weakening even though price has not yet confirmed a trend reversal.
Weekly Market Structure Analysis
Market structure is one of the most reliable ways to identify trend direction.
The weekly chart continues to display a sequence of:
- Lower Highs (LH)
- Lower Lows (LL)
This pattern confirms that sellers still control the medium-term trend.
However, one important observation is that the distance between recent lower lows has become much smaller than during previous declines. This often happens when selling pressure begins to fade and buyers slowly return to the market.
A complete bullish reversal would require AVAX to:
- Break above the most recent Lower High.
- Form a Higher Low (HL).
- Create a Higher High (HH).
Until these conditions are met, rallies should be viewed as recovery attempts rather than confirmed trend reversals.
EMA Analysis
Moving averages help identify dynamic support and resistance.
Your weekly chart shows the following EMA levels:
| EMA | Value | Signal |
|---|---|---|
| EMA20 | $8.29 | Bearish |
| EMA50 | $12.55 | Strong Bearish |
| EMA100 | $17.38 | Strong Bearish |
| EMA200 | $22.75 | Long-Term Bearish |
The current price remains below every major EMA.
This alignment is important because it shows that:
- Short-term trend is bearish.
- Medium-term trend is bearish.
- Long-term trend is bearish.
For sentiment to improve, AVAX must first reclaim the 20-week EMA near $8.30. A move above this level would be the first technical signal that buyers are regaining strength.
Breaking above the 50-week EMA would further strengthen the bullish case, while sustained trading above the 100-week and 200-week EMAs would indicate a much larger trend reversal.
RSI Analysis
The Relative Strength Index on the weekly chart currently stands at 33.91.
This level suggests that:
- Selling pressure is still present.
- Momentum remains weak.
- The market is approaching oversold territory but has not reached it.
Historically, an RSI between 30 and 35 often appears near important market bottoms. However, traders should avoid relying solely on RSI, as prices can remain weak for extended periods during strong bearish trends.
A sustained move above 50 would indicate improving market momentum.
MACD Analysis
One of the most interesting signals on the weekly timeframe comes from the MACD.
Unlike the monthly chart, the weekly MACD has shifted to Bullish.
This does not mean the overall trend has changed, but it does indicate that bearish momentum is losing strength.
A bullish MACD during a bearish price trend often signals one of two possibilities:
- A relief rally.
- The early stage of a longer recovery.
Confirmation is still required through higher highs, stronger volume, and a break above key resistance levels.
Volume Analysis
The weekly chart continues to show low trading volume.
Low volume tells us that:
- Institutional participation remains limited.
- Large investors have not yet aggressively accumulated AVAX.
- Strong breakout confirmation is still missing.
For a sustainable recovery, rising prices should be supported by increasing trading volume. Without higher volume, breakouts have a greater chance of failing.
Weekly Support Levels
The weekly chart highlights several important support areas.
| Support Zone | Strength |
|---|---|
| $6.30–$6.60 | Primary support |
| $5.80–$6.00 | Secondary support |
| $5.00 | Major long-term support |
The current support zone around $6.30–$6.60 has held multiple times over recent weeks, making it the most important level for buyers to defend.
As long as AVAX remains above this area, the possibility of a gradual recovery remains intact.
Weekly Resistance Levels
Several resistance zones must be cleared before the trend can improve.
| Resistance Zone | Importance |
|---|---|
| $7.80–$8.30 | Near EMA20 and first breakout level |
| $10.00–$12.50 | Strong medium-term resistance |
| $17.00–$18.00 | EMA100 region |
| Above $22.75 | EMA200 and major long-term breakout |
The first major challenge for buyers is the $7.80–$8.30 area. A weekly close above this range would improve market confidence and could attract additional buying interest.
Bullish Scenario
The medium-term outlook would improve if AVAX can achieve the following:
- Hold above $6.30–$6.60 support.
- Break above $8.30 with strong trading volume.
- Continue printing higher lows.
- Weekly RSI climbs above 45–50.
- Bullish MACD remains intact.
If these conditions are met, AVAX could begin targeting the next resistance zones around $10.00–$12.50.
Bearish Scenario
The bearish trend could continue if:
- Price loses the $6.30 support area.
- Weekly volume increases during sell-offs.
- RSI drops below 30.
- Lower highs continue without any breakout.
Under this scenario, AVAX could revisit the $5.80 support area or even test the psychologically important $5.00 level before finding stronger buying interest.
What Does the Weekly Chart Tell Investors?
The weekly chart suggests that Avalanche is still in a corrective phase, but it also shows some encouraging signs that the downtrend may be losing strength. The bullish MACD indicates improving momentum, while the repeated defense of the $6.30–$6.60 support zone suggests buyers are becoming more active.
However, caution is still warranted. Price remains below all major weekly moving averages, and the market structure continues to favor sellers. A confirmed trend reversal will likely require a weekly close above the 20-week EMA, followed by the formation of higher highs and higher lows.
For long-term investors, the current market may represent a period to monitor closely rather than chase aggressively. Confirmation of stronger momentum and improving volume will provide greater confidence that Avalanche is transitioning from consolidation into a sustainable recovery.
AVAX Daily Technical Analysis
The daily chart provides a closer look at Avalanche's short-term trend and is especially useful for swing traders and active investors. While the monthly and weekly charts show that AVAX remains in a broader bearish trend, the daily timeframe helps determine whether buyers are beginning to build momentum for a recovery.
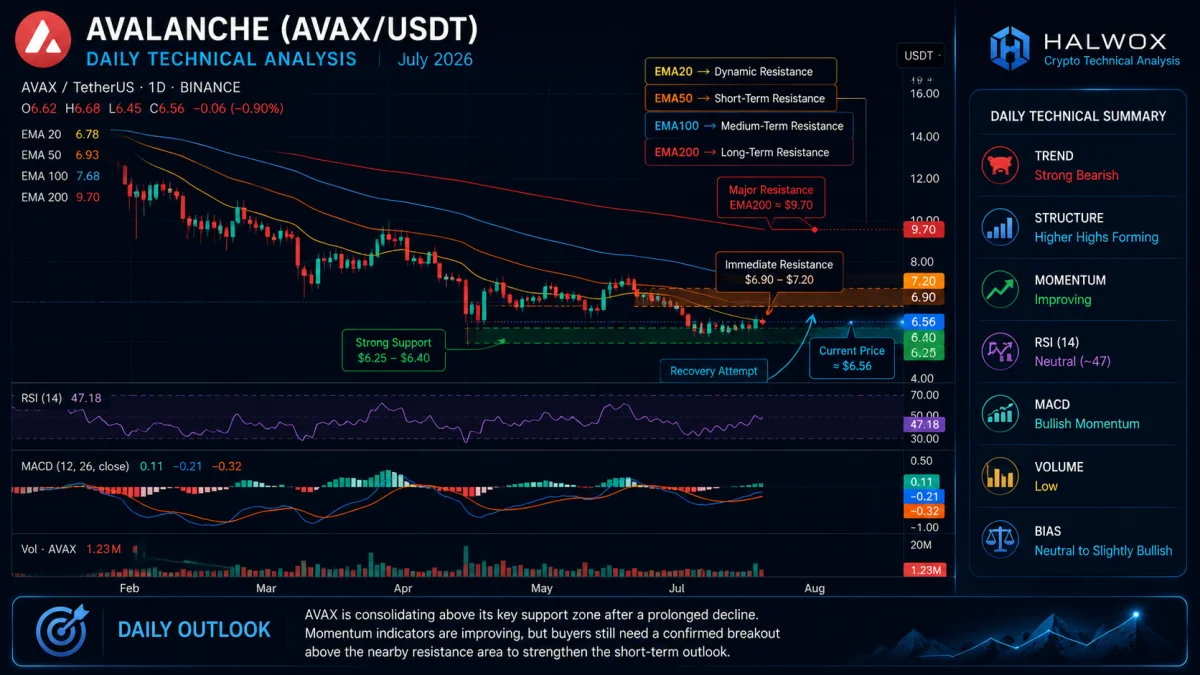
Based on the latest daily chart, AVAX is trading around $6.56 after stabilizing above a key support area. The recent price action suggests that selling pressure has weakened, but buyers still need to overcome several important resistance levels before a meaningful trend reversal can be confirmed.
Although some technical indicators are showing early signs of improvement, the overall daily trend remains cautious until price starts closing above major moving averages.
Daily Market Overview
| Indicator | Current Status | Interpretation |
|---|---|---|
| Current Price | $6.56 | Trading near support |
| Trend | Bearish | Recovery attempt underway |
| Market Structure | Weak Recovery | Buyers defending support |
| Daily RSI | 46.67 | Neutral momentum |
| Daily MACD | Bullish | Positive momentum improving |
| Volume | Low | Buyers remain cautious |
| Volatility | Moderate | Normal price fluctuations |
Compared to the weekly timeframe, the daily chart paints a slightly more optimistic picture. Momentum indicators are improving, but price has not yet confirmed a breakout above resistance.
Daily Market Structure
One encouraging sign on the daily chart is that the aggressive selling seen earlier has slowed considerably.
Instead of making sharp new lows, AVAX has entered a period of consolidation where buyers and sellers are competing within a relatively narrow price range.
This behavior often appears before one of two outcomes:
- A breakout that starts a recovery.
- A breakdown that resumes the larger bearish trend.
Currently, AVAX is attempting to establish a higher trading range above the recent lows, but the market has not yet produced a confirmed series of higher highs and higher lows.
For the daily trend to turn bullish, Avalanche must:
- Hold above current support.
- Break the most recent swing high.
- Continue forming higher lows.
Until these conditions are met, the broader trend remains neutral to bearish.
Daily EMA Analysis
Moving averages provide one of the clearest indications of market strength.
According to your daily chart:
| EMA | Approximate Level | Signal |
|---|---|---|
| EMA20 | Above Price | Bearish |
| EMA50 | Above Price | Bearish |
| EMA100 | Well Above Price | Strong Bearish |
| EMA200 | Far Above Price | Long-Term Bearish |
The price remains below every major EMA, confirming that sellers still control the overall daily trend.
However, one important detail is that the gap between price and the 20-day EMA has narrowed. This means buyers are gradually reducing bearish pressure.
The first technical improvement would be a daily close above the 20-day EMA. If AVAX can then reclaim the 50-day EMA, market confidence could improve significantly.
RSI Analysis
The Relative Strength Index on the daily chart is approximately 46.67.
This reading indicates:
- Momentum is no longer heavily bearish.
- Buyers and sellers are becoming more balanced.
- The market is approaching a neutral zone.
An RSI between 45 and 55 often reflects consolidation rather than a strong trend.
Unlike the weekly RSI, which still shows weakness, the daily RSI suggests short-term selling pressure has eased.
If RSI rises above 50, it would indicate that buyers are beginning to gain momentum.
A move above 60 would strengthen the bullish outlook further.
MACD Analysis
The daily MACD is currently showing a Bullish signal.
This is one of the strongest positive developments on the daily chart.
A bullish MACD crossover generally indicates:
- Downward momentum is slowing.
- Buyers are becoming more active.
- The probability of a short-term recovery increases.
However, MACD should always be confirmed by price action.
If AVAX fails to break resistance despite the bullish MACD, momentum could weaken again.
Volume Analysis
Volume remains relatively low despite recent stabilization.
This tells us:
- Buyers are returning slowly.
- Institutional demand remains limited.
- Strong conviction is still missing.
Ideally, a bullish breakout should be accompanied by increasing volume.
Higher volume confirms that more market participants support the move, making it more likely to continue.
Without stronger volume, any rally could struggle to sustain itself.
Key Daily Support Levels
The daily chart highlights several important areas where buyers may step in.
| Support Level | Importance |
|---|---|
| $6.30–$6.50 | Immediate support |
| $6.00 | Psychological support |
| $5.80 | Strong historical support |
| $5.00 | Major long-term support |
The current support near $6.30–$6.50 is the most important level for short-term traders.
As long as AVAX remains above this zone, buyers have an opportunity to build momentum toward higher resistance levels.
Key Daily Resistance Levels
Before Avalanche can confirm a stronger recovery, it must overcome several resistance zones.
| Resistance Level | Importance |
|---|---|
| $6.90–$7.10 | Immediate resistance |
| $7.50–$8.00 | Major breakout zone |
| $8.30 | Weekly EMA20 resistance |
| $10.00 | Psychological resistance |
A daily close above $7.10 would improve short-term sentiment, while a sustained move above $8.00 would significantly strengthen the bullish case.
Bullish Scenario
The daily chart could turn more positive if the following conditions develop:
- Price holds above $6.30 support.
- Daily RSI climbs above 50.
- Bullish MACD remains active.
- Trading volume increases.
- Price closes above the 20-day EMA.
- Buyers successfully break the $7.10 resistance.
If these conditions are met, AVAX could begin targeting the $7.50–$8.30 region over the coming weeks.
Bearish Scenario
The bearish outlook would regain strength if:
- AVAX loses the $6.30 support zone.
- Daily RSI falls below 40.
- MACD turns bearish again.
- Selling volume increases.
In this scenario, Avalanche could revisit the $6.00 level, with $5.80 acting as the next major support.
Daily Outlook for Traders
The daily chart presents the first meaningful signs that Avalanche may be attempting to stabilize after a prolonged decline. The bullish MACD crossover and improving RSI suggest that bearish momentum is fading, while the repeated defense of the $6.30–$6.50 support zone indicates buyers are becoming more active.
However, traders should remain patient. The price still trades below all major daily moving averages, and the overall market structure has not yet shifted into a confirmed uptrend. For the short-term outlook to improve, AVAX needs to break above nearby resistance levels with stronger trading volume and continue forming higher highs and higher lows.
At this stage, the daily chart favors cautious optimism rather than aggressive bullishness. The technical signals are improving, but confirmation is still needed before declaring that a sustained recovery is underway.
Key Takeaways from the Daily Chart
| Factor | Outlook |
|---|---|
| Overall Trend | Bearish but stabilizing |
| Momentum | Improving |
| RSI | Neutral (46.67) |
| MACD | Bullish |
| Support | $6.30–$6.50 |
| Resistance | $6.90–$7.10 |
| Short-Term Bias | Neutral to Slightly Bullish |
| Risk Level | Moderate |
AVAX 4-Hour Technical Analysis
The 4-hour (4H) chart provides the clearest picture of Avalanche's short-term momentum. Unlike the monthly and weekly charts, which focus on the broader trend, the 4H timeframe helps traders identify potential breakout opportunities, support and resistance zones, and changes in momentum over the next few days.
Based on your latest 4H chart, AVAX is trading around $6.56 after bouncing from recent lows. While buyers have managed to slow the previous decline, the price is still trading below several important moving averages, meaning the short-term trend has not yet fully shifted in favor of the bulls.
The market is currently in a consolidation phase, where neither buyers nor sellers have complete control. The next breakout from this range is likely to determine AVAX's direction for the remainder of July.
4H Market Overview
| Indicator | Current Status | Interpretation |
|---|---|---|
| Current Price | $6.56 | |
| Short-Term Trend | Sideways to Slightly Bullish | |
| Market Structure | Consolidation | |
| RSI | 48.44 | |
| MACD | Bullish Momentum Weakening | |
| Volume | Moderate | |
| Volatility | Moderate |
The 4H chart reflects a market that is attempting to recover but still lacks the buying strength needed for a confirmed breakout.
Short-Term Market Structure
One of the biggest differences between the daily and 4H charts is that the lower timeframe is beginning to show early signs of stabilization.
Instead of creating aggressive lower lows, AVAX has started moving within a tighter price range.
This suggests that:
- Sellers are becoming less aggressive.
- Buyers are gradually entering the market.
- A breakout may occur once enough momentum builds.
However, the chart has not yet confirmed a bullish market structure.
To do that, AVAX must:
- Break above the recent swing high.
- Continue making higher lows.
- Hold above the breakout level.
Until then, traders should treat every upward move as a recovery attempt rather than a confirmed trend reversal.
EMA Analysis
Moving averages on the 4H chart help identify immediate trend direction.
According to your chart:
| EMA | Position | Signal |
|---|---|---|
| EMA20 | Near Current Price | Neutral |
| EMA50 | Slightly Above Price | Bearish |
| EMA100 | Above Price | Bearish |
| EMA200 | Well Above Price | Strong Bearish |
This alignment shows that:
- The short-term trend is improving.
- Medium-term momentum remains weak.
- Long-term bearish pressure is still present.
The first important signal would be a sustained move above the 20 EMA.
A stronger bullish confirmation would occur if AVAX successfully breaks and holds above the 50 EMA with increased trading volume.
RSI Analysis
The 4H RSI is currently around 48.44.
This places momentum almost exactly in the neutral zone.
Here's what it means:
- Buyers and sellers are relatively balanced.
- The market is not overbought.
- The market is not oversold.
- There is room for a move in either direction.
If RSI moves above 55–60, it would indicate buyers are gaining momentum.
If RSI falls below 40, bearish pressure could return.
At the moment, RSI supports a consolidation outlook rather than a strong directional move.
MACD Analysis
The MACD on the 4H chart shows that bullish momentum has improved compared to previous sessions, but the strength of the move remains limited.
This tells us:
- Selling pressure has decreased.
- Buyers are attempting to regain control.
- Momentum is improving but still needs confirmation.
A continued bullish MACD crossover combined with stronger price action would increase the probability of a breakout above resistance.
However, if the MACD begins to flatten while price remains below resistance, the recovery could lose momentum.
Volume Analysis
Trading volume on the 4H timeframe remains moderate.
This suggests:
- Buyers are participating.
- Sellers have reduced their activity.
- Large institutional buying is still absent.
A breakout supported by increasing volume would carry much greater confidence than a breakout on weak volume.
Volume confirmation remains one of the most important factors traders should monitor.
Immediate Support Levels
The 4H chart highlights several important short-term support areas.
| Support Zone | Importance |
|---|---|
| $6.45–$6.55 | Immediate intraday support |
| $6.30 | Strong short-term support |
| $6.00 | Psychological support |
| $5.80 | Major downside support |
The $6.45–$6.55 region has acted as a base during recent trading sessions. Holding above this level keeps the short-term recovery scenario alive.
Immediate Resistance Levels
Several resistance levels stand in the way of a stronger recovery.
| Resistance Zone | Importance |
|---|---|
| $6.80–$6.95 | First breakout zone |
| $7.20 | Strong resistance |
| $7.50–$8.00 | Major swing resistance |
| $8.30 | Weekly resistance |
The $6.80–$6.95 area is the first obstacle for buyers. A convincing breakout above this range could encourage additional buying and shift momentum toward the next resistance level.
Bullish Scenario
The short-term bullish outlook becomes more likely if AVAX can:
- Hold above $6.45 support.
- Break above $6.95 resistance.
- Close above the 20 EMA and 50 EMA.
- Maintain RSI above 55.
- Increase trading volume during the breakout.
If these conditions are met, AVAX could target the $7.20–$7.50 area over the next several sessions.
Bearish Scenario
The bearish outlook would strengthen if:
- AVAX falls below $6.45.
- RSI drops below 40.
- MACD turns bearish again.
- Selling volume increases.
- Price closes below $6.30.
In that case, the market could revisit the $6.00 support level, with $5.80 acting as the next major downside target.
Trading Strategy Based on the 4H Chart
For short-term traders, patience is important. The chart currently reflects consolidation rather than a strong trend, meaning false breakouts are possible.
Bullish confirmation:
- Price closes above $6.95.
- Volume increases.
- RSI rises above 55.
- MACD remains bullish.
Bearish confirmation:
- Price closes below $6.30.
- Selling volume increases.
- RSI drops below 40.
- Lower lows begin forming again.
Waiting for confirmation instead of predicting the breakout direction can help reduce the risk of entering a trade too early.
4H Outlook Summary
The 4-hour chart suggests that Avalanche is entering an important decision zone. The sharp selling pressure seen in previous weeks has eased, and buyers are gradually defending key support levels. At the same time, the market has not yet produced the technical confirmation needed to declare a sustained recovery.
Overall, the short-term outlook is neutral to slightly bullish, provided AVAX continues holding above the $6.45–$6.55 support area. A breakout above $6.95, supported by stronger trading volume and improving momentum indicators, would strengthen the case for a move toward $7.20–$7.50. Conversely, a loss of support below $6.30 could shift momentum back in favor of sellers.
After analyzing the Monthly, Weekly, Daily, and 4-Hour charts, we can combine all the technical signals to estimate Avalanche's most likely price movement for the remainder of July 2026.
The higher timeframes (Monthly and Weekly) still show a bearish long-term trend, while the Daily and 4H charts indicate that selling pressure has weakened. This combination often leads to a period of sideways trading before the market decides its next major direction.
In simple terms, AVAX is trying to recover, but buyers still need to prove they have enough strength to reverse the broader downtrend.
July 2026 Technical Outlook
| Timeframe | Trend | Signal |
|---|---|---|
| Monthly | Bearish | Long-term trend remains weak |
| Weekly | Bearish | Early signs of stabilization |
| Daily | Neutral to Slightly Bullish | Recovery attempt in progress |
| 4-Hour | Sideways | Consolidation near support |
When all four timeframes are viewed together, the market currently favors consolidation with a slight bullish bias, rather than a strong breakout or a sharp decline.
Why AVAX Could Recover in July
Several technical signals suggest that buyers are gradually returning to the market.
1. Strong Support Has Held
The $6.30–$6.60 area has been tested multiple times without breaking lower.
Repeatedly holding above an important support level usually indicates that buyers are willing to defend that price range.
2. Selling Pressure Is Weakening
Earlier in the year, AVAX experienced aggressive selling that pushed the price lower.
Recently, however:
- Candles have become smaller.
- Price swings are less volatile.
- New lows are becoming less frequent.
This often signals that sellers are losing momentum.
3. Daily MACD Has Turned Bullish
The Daily MACD has already shifted into bullish territory.
While this alone does not confirm a new uptrend, it is often one of the first indicators that momentum is beginning to improve.
4. RSI Is Returning Toward Neutral
Both the Daily and 4H RSI readings have recovered from oversold conditions.
This suggests that the market has room to move higher before becoming overbought.
What Could Limit the Rally?
Despite these positive signs, several important challenges remain.
Price Is Still Below Major EMAs
Across every major timeframe, AVAX continues to trade below:
- 20 EMA
- 50 EMA
- 100 EMA
- 200 EMA
This confirms that the larger trend still favors sellers.
Trading Volume Remains Low
A healthy breakout is normally supported by increasing trading volume.
Current volume remains relatively modest, suggesting that institutional buyers have not yet entered the market in large numbers.
Without stronger participation, rallies may struggle to continue.
Resistance Levels Are Close
The first resistance appears only a short distance above the current price.
This means buyers will quickly face selling pressure if AVAX starts moving higher.
Expected Trading Range for July
Based on the current technical structure, Avalanche is likely to trade within the following range during the remainder of July.
| Scenario | Expected Range |
|---|---|
| Conservative | $6.30 – $6.90 |
| Base Case | $6.40 – $7.20 |
| Bullish Case | $7.20 – $8.00 |
| Bearish Case | $5.80 – $6.20 |
The Base Case currently has the highest probability because it aligns with the existing market structure across all four timeframes.
Week-by-Week Outlook
Week 1
Expected Price:
$6.40–$6.70
The market is likely to continue consolidating while traders watch for a breakout above immediate resistance.
Momentum should remain relatively balanced.
Bias: Neutral
Week 2
Expected Price:
$6.50–$6.90
If buyers continue defending support, AVAX could slowly challenge the first resistance zone.
A rise in trading volume would strengthen this scenario.
Bias: Slightly Bullish
Week 3
Expected Price:
$6.70–$7.10
Assuming Bitcoin remains stable and the broader crypto market avoids major weakness, Avalanche could attempt its first meaningful breakout.
This area may attract increased selling pressure, so traders should watch for confirmation rather than assuming a breakout will succeed.
Bias: Bullish if volume increases
Week 4
Expected Price:
$6.80–$7.20
By the end of the month, AVAX could trade near the upper end of its expected range if bullish momentum continues.
However, failure to hold above resistance could lead to another period of sideways movement rather than an immediate decline.
Bias: Moderately Bullish
July Price Prediction Table
| Week | Expected Low | Expected High | Outlook |
|---|---|---|---|
| Week 1 | $6.40 | $6.70 | Sideways |
| Week 2 | $6.50 | $6.90 | Slight Recovery |
| Week 3 | $6.70 | $7.10 | Bullish Attempt |
| Week 4 | $6.80 | $7.20 | Recovery Continues |
Probability Analysis
Every technical prediction involves uncertainty. Based on the current chart structure, these are the estimated probabilities for the remainder of July.
| Scenario | Probability |
|---|---|
| Sideways Consolidation | 45% |
| Moderate Recovery | 35% |
| Strong Bullish Breakout | 10% |
| Bearish Breakdown | 10% |
The market currently favors consolidation, but the improving momentum on lower timeframes increases the likelihood of a gradual recovery if key resistance levels are broken.
Key Levels to Watch in July
Bullish Confirmation
AVAX would strengthen its short-term outlook if it:
- Holds above $6.30
- Breaks above $6.95
- Closes above $7.20
- Forms higher highs and higher lows
- Sees an increase in trading volume
If these conditions are met, buyers could begin targeting the $7.50–$8.00 area.
Bearish Confirmation
The bearish outlook would become more likely if AVAX:
- Closes below $6.30
- Breaks below $6.00
- RSI falls below 40
- MACD turns bearish on the Daily chart
- Selling volume increases
In this scenario, the next major support would be around $5.80, with the possibility of testing $5.00 if broader market sentiment deteriorates.
July 2026 Forecast Summary
Based on the current technical analysis, Avalanche appears to be transitioning from a period of strong selling into one of stabilization. The long-term trend remains bearish, but improving momentum on the Daily and 4H charts suggests that buyers are gradually becoming more active.
The most likely outcome for the remainder of July is sideways trading with a modest upward bias, provided the key support around $6.30–$6.60 continues to hold. A confirmed breakout above $6.95–$7.20, supported by stronger trading volume, could open the door to further gains toward the $7.50–$8.00 region. On the other hand, losing the current support zone would shift the outlook back in favor of sellers.
Overall, the technical picture suggests that cautious optimism is justified, but confirmation through price action and volume remains essential before declaring the start of a sustained bullish trend.
While the monthly and weekly charts help long-term investors understand the broader trend, many traders are more interested in what could happen over the next few days. The 4-hour and daily charts provide the best clues for short-term price movements because they react more quickly to changes in market sentiment.
Based on the current technical setup, AVAX is showing signs of stabilization above a key support zone. However, the market has not yet confirmed a breakout above resistance, meaning traders should prepare for both bullish and bearish scenarios.
The next seven days are likely to determine whether Avalanche can continue building momentum or remains trapped in a consolidation range.
Short-Term Technical Summary
| Indicator | Signal | Outlook |
|---|---|---|
| Trend | Sideways | Neutral |
| Momentum | Improving | Slightly Bullish |
| RSI | Neutral | Room for upside |
| MACD | Bullish | Positive momentum |
| Volume | Low | Needs improvement |
| Market Structure | Consolidation | Waiting for breakout |
The technical indicators currently favor a slow recovery, but confirmation through higher trading volume is still needed.
7-Day AVAX Price Prediction
Important: These are probability-based estimates derived from the technical structure visible on the charts. Actual prices may differ depending on Bitcoin's movement, market sentiment, and unexpected news.
| Day | Expected Low | Expected High | Expected Trend |
|---|---|---|---|
| Day 1 | $6.45 | $6.65 | Sideways |
| Day 2 | $6.48 | $6.72 | Slightly Bullish |
| Day 3 | $6.52 | $6.80 | Buyers Testing Resistance |
| Day 4 | $6.55 | $6.88 | Mild Recovery |
| Day 5 | $6.60 | $6.95 | Breakout Attempt |
| Day 6 | $6.62 | $7.05 | Bullish if Volume Increases |
| Day 7 | $6.70 | $7.15 | Recovery Continues |
Overall, the projected range for the next seven days is $6.45 to $7.15, assuming no major changes in the broader cryptocurrency market.
Daily Outlook
Day 1
The market is expected to remain relatively quiet as buyers continue defending the support zone around $6.45–$6.55.
Unless trading volume increases significantly, AVAX is likely to trade within a narrow range.
Expected Bias: Neutral
Day 2
Momentum indicators may continue improving if Bitcoin remains stable.
Buyers could begin testing the first short-term resistance level.
Expected Bias: Slightly Bullish
Day 3
This could be the first meaningful test of resistance.
If AVAX closes above recent highs, short-term traders may become more active.
Expected Bias: Bullish Attempt
Day 4
Assuming support remains intact, Avalanche may continue forming higher lows.
This would strengthen confidence in the ongoing recovery.
Expected Bias: Moderately Bullish
Day 5
The market could attempt a breakout toward the $6.95 resistance zone.
However, traders should watch trading volume closely. A breakout without stronger volume has a higher chance of failing.
Expected Bias: Breakout Watch
Day 6
If buyers successfully clear resistance, momentum could accelerate toward $7.05.
Failure to maintain higher prices could result in another period of sideways trading.
Expected Bias: Bullish
Day 7
If bullish momentum continues, AVAX may finish the week near $7.15.
If resistance remains strong, the price may consolidate instead of extending higher.
Expected Bias: Slightly Bullish
Best Support Levels for Short-Term Traders
These are the most important price levels to monitor over the coming week.
| Support Zone | Importance |
|---|---|
| $6.45–$6.55 | Immediate support |
| $6.30 | Strong support |
| $6.00 | Psychological support |
| $5.80 | Major downside support |
Holding above these levels would keep the short-term recovery scenario intact.
Key Resistance Levels
The following resistance zones are likely to attract selling pressure.
| Resistance Zone | Importance |
|---|---|
| $6.80–$6.95 | First breakout level |
| $7.20 | Major short-term resistance |
| $7.50–$8.00 | Strong resistance zone |
| $8.30 | Weekly resistance |
A daily close above $6.95 would significantly improve the short-term outlook.
Bullish Trading Scenario
The bullish case becomes more likely if AVAX can:
- Hold above $6.45
- Break above $6.95
- Maintain a bullish MACD crossover
- Push the RSI above 55
- Show increasing trading volume
- Form consecutive higher highs and higher lows
If these conditions are met, AVAX could extend its recovery toward $7.20–$7.50.
Bearish Trading Scenario
The bearish outlook strengthens if AVAX:
- Falls below $6.30
- RSI drops below 40
- MACD turns bearish
- Selling volume increases
- Forms a new lower low on the 4-hour chart
Under this scenario, the next downside targets would be $6.00 and $5.80.
Trading Plan for Different Types of Investors
| Investor Type | Suggested Approach |
|---|---|
| Day Traders | Wait for a confirmed breakout above $6.95 or a breakdown below $6.30 before entering a position. |
| Swing Traders | Watch for higher highs and higher lows on the daily chart. Consider entries only after confirmation of improved momentum. |
| Long-Term Investors | Focus on the weekly and monthly trend rather than short-term fluctuations. Gradual accumulation may be considered only if the broader market remains stable and AVAX continues holding key support levels. |
Risk Factors for the Next Week
Even if the technical indicators continue improving, several external factors could affect AVAX's price:
- Bitcoin volatility: A sharp move in Bitcoin often influences the entire crypto market, including AVAX.
- Macroeconomic news: Interest rate decisions, inflation data, or geopolitical events can quickly change investor sentiment.
- Avalanche ecosystem developments: Major partnerships, protocol upgrades, or security concerns may lead to sudden price movements.
- Market liquidity: Low trading volume can result in false breakouts and increased price volatility.
Monitoring these factors alongside technical analysis can help traders make more informed decisions.
Short-Term Forecast Summary
The technical outlook for the next seven days is cautiously optimistic. Avalanche has shown encouraging signs of stabilization, with improving momentum indicators and buyers defending the $6.45–$6.55 support zone. However, the market remains below key moving averages, and trading volume has yet to confirm a strong recovery.
As long as AVAX stays above $6.30, the probability of a gradual move toward $7.15 remains reasonable. A decisive break above $6.95, supported by stronger volume, would strengthen the bullish case and could pave the way for further gains. Conversely, a breakdown below support would increase the risk of another test of the $6.00–$5.80 area.
AVAX Price Prediction (August–December 2026)
While short-term traders focus on daily price movements, many investors want to know where Avalanche could head over the next several months. The medium-term outlook depends not only on technical indicators but also on broader cryptocurrency market conditions, Bitcoin's trend, and continued development within the Avalanche ecosystem.
Based on the current monthly, weekly, daily, and 4-hour charts, AVAX appears to be in the early stages of stabilization. However, the long-term trend has not yet turned bullish. Because of this, our forecast assumes a gradual recovery rather than an explosive rally.
Monthly Price Prediction Overview
| Month | Expected Low | Expected High | Overall Outlook |
|---|---|---|---|
| August 2026 | $6.60 | $7.80 | Recovery Begins |
| September 2026 | $6.90 | $8.50 | Bullish Momentum Improves |
| October 2026 | $7.40 | $9.20 | Stronger Buying Interest |
| November 2026 | $8.00 | $10.20 | Medium-Term Recovery |
| December 2026 | $8.50 | $11.50 | Positive Year-End Outlook |
Forecast Note: These ranges assume that the overall cryptocurrency market remains stable and that Bitcoin does not experience a major bearish correction.
August 2026 Price Prediction
Expected Range
$6.60 – $7.80
August is likely to continue the recovery attempts that begin in late July. If buyers successfully defend the $6.30–$6.60 support zone, AVAX could gradually move toward its first major resistance.
However, resistance near $7.50–$7.80 may limit upside unless supported by stronger trading volume.
Technical Outlook
- Buyers continue defending key support.
- RSI gradually moves toward 50.
- MACD remains positive.
- Price attempts to reclaim short-term moving averages.
Probability
Moderately Bullish
September 2026 Price Prediction
Expected Range
$6.90 – $8.50
September could become an important month because AVAX may attempt to break above the first major weekly resistance.
If Bitcoin continues trending higher, Avalanche may benefit from improving investor confidence across the altcoin market.
A successful move above $8.00 would significantly improve medium-term sentiment.
Key Factors
- Higher trading volume.
- Stronger market participation.
- Possible breakout above the 20-week EMA.
- Improving market structure.
Probability
Bullish
October 2026 Price Prediction
Expected Range
$7.40 – $9.20
October may provide the first real opportunity for AVAX to challenge stronger resistance levels.
By this stage, if buyers continue building higher lows, the market structure would begin shifting away from the prolonged bearish trend.
Investors should monitor whether AVAX can sustain trading above the $8.50 region.
Technical Signals to Watch
- Weekly RSI above 45.
- Continued bullish MACD.
- Higher trading volume.
- Consecutive higher highs.
Probability
Moderately Bullish
November 2026 Price Prediction
Expected Range
$8.00 – $10.20
November could see increased volatility as AVAX approaches psychologically important price levels.
If broader market conditions remain supportive, the price may attempt to break above $10.00 for the first time in several months.
However, profit-taking around this area should also be expected.
Positive Catalysts
- Improved investor sentiment.
- Strong Bitcoin performance.
- Continued Avalanche ecosystem growth.
- Increased institutional interest.
Probability
Bullish
December 2026 Price Prediction
Expected Range
$8.50 – $11.50
December often experiences increased trading activity as investors reassess their portfolios before the new year. If AVAX maintains positive momentum through the previous months, it could end the year near its highest levels since the recovery began.
While a move above $11.50 cannot be ruled out, the current technical structure does not yet support a more aggressive target without a confirmed change in the long-term trend.
Year-End Technical Outlook
- Higher probability of sustained recovery.
- Medium-term trend improves.
- Buyers challenge stronger resistance levels.
- Long-term bullish confirmation still pending.
What Could Push AVAX Higher?
Several developments could help Avalanche outperform the base-case forecast.
1. Strong Bitcoin Rally
Historically, Avalanche performs better when Bitcoin enters a sustained uptrend. Increased confidence in the broader crypto market often leads investors toward established altcoins like AVAX.
2. Ecosystem Expansion
Growth in decentralized applications, gaming projects, tokenized assets, and DeFi platforms built on Avalanche could increase network activity and demand for AVAX.
3. Institutional Adoption
New partnerships with financial institutions or enterprise blockchain initiatives could improve long-term investor confidence.
4. Higher Staking Participation
More tokens locked in staking reduce the liquid supply available for trading, which can support prices if demand increases.
5. Improved Market Sentiment
Lower interest rates, favorable regulations, and increased institutional investment in digital assets could strengthen demand across the cryptocurrency market.
Risks That Could Limit Growth
Investors should also consider factors that could prevent AVAX from reaching the projected price ranges.
Weak Bitcoin Performance
If Bitcoin enters another major correction, Avalanche could face additional selling pressure regardless of its own fundamentals.
Regulatory Uncertainty
Changes in cryptocurrency regulations or unfavorable government policies may reduce investor confidence.
Lower Trading Volume
Breakouts supported by weak volume are more likely to fail. Without increased participation, upward momentum may remain limited.
Competition
Avalanche competes with several established Layer 1 blockchains. Continued innovation by competing networks could influence capital flows within the crypto market.
Global Economic Conditions
Inflation, interest rate decisions, and broader financial market uncertainty can all impact risk assets, including cryptocurrencies.
Medium-Term Technical Outlook
Looking beyond the next few weeks, Avalanche appears to be entering a rebuilding phase rather than a confirmed bull market. The technical indicators suggest that bearish momentum has weakened, but the market still needs to reclaim important moving averages and resistance levels before the long-term outlook changes.
If AVAX successfully holds above the $6.30–$6.60 support zone and gradually breaks through the $8.00–$8.50 resistance area, the probability of a sustained recovery increases significantly.
Conversely, a loss of key support would likely delay any meaningful recovery and increase the risk of revisiting lower price levels.
August–December 2026 Forecast Summary
The second half of 2026 could represent a transition period for Avalanche. Instead of expecting a rapid return to previous cycle highs, investors should focus on whether the market continues building higher lows, improving momentum, and reclaiming important resistance levels.
Our base-case outlook suggests a gradual recovery, with AVAX potentially ending 2026 in the $8.50–$11.50 range if current technical improvements continue and the broader cryptocurrency market remains supportive.
The next phase will extend this analysis even further by examining AVAX Price Prediction from 2026 through 2030, where we'll explore multiple long-term scenarios, yearly forecasts, and the key factors that could influence Avalanche's future over the coming years.
AVAX Price Prediction 2026–2030 (Long-Term Forecast)
Cryptocurrency investing is often about looking beyond the next few days or weeks. While short-term price movements are driven by market sentiment and technical factors, long-term performance depends on adoption, innovation, macroeconomic conditions, and the overall growth of the blockchain ecosystem.
Avalanche has established itself as one of the leading Layer 1 blockchain networks by focusing on scalability, low transaction costs, and fast finality. Whether AVAX reaches significantly higher prices over the coming years will largely depend on how successfully the network expands its ecosystem and whether the broader cryptocurrency market enters another sustained bull cycle.
Our long-term forecasts combine the technical analysis presented earlier with realistic expectations for market development. These are probability-based scenarios, not guarantees.
Long-Term AVAX Price Prediction Table
| Year | Conservative | Base Case | Bullish Scenario |
|---|---|---|---|
| 2026 | $7.50 | $10.00 | $11.50 |
| 2027 | $9.50 | $15.00 | $18.00 |
| 2028 | $12.00 | $20.00 | $25.00 |
| 2029 | $15.00 | $26.00 | $32.00 |
| 2030 | $18.00 | $35.00 | $45.00 |
These forecasts assume continued development of the Avalanche ecosystem, steady growth in blockchain adoption, and no prolonged global financial crisis affecting digital assets.
AVAX Price Prediction for 2026
Expected Range
$7.50–$11.50
The remainder of 2026 is likely to focus on recovery rather than rapid expansion. The technical charts suggest Avalanche is attempting to build a long-term base after an extended correction.
If buyers continue defending key support levels and successfully reclaim major moving averages, AVAX could finish the year trading above recent highs.
Factors Supporting Growth
- Recovery in Bitcoin.
- Improved investor confidence.
- More active Avalanche ecosystem.
- Increased DeFi activity.
Risks
- Weak market liquidity.
- Failure to break long-term resistance.
- Global economic uncertainty.
Overall Outlook: Moderately Bullish
AVAX Price Prediction for 2027
Expected Range
$10–$18
By 2027, Avalanche could benefit from stronger institutional participation if the cryptocurrency market enters another expansion phase.
Historically, Layer 1 blockchain projects perform well during bullish market cycles because developers, investors, and decentralized applications all experience increased activity.
If Avalanche continues attracting developers and users, demand for AVAX could gradually increase.
Technical Expectations
- Weekly trend shifts bullish.
- Monthly RSI moves above 50.
- Price trades above major moving averages.
- Market structure changes from lower highs to higher highs.
Overall Outlook: Bullish
AVAX Price Prediction for 2028
Expected Range
$12–$25
Assuming the broader blockchain industry continues expanding, 2028 could represent one of Avalanche's strongest years.
By this stage, investors will likely focus less on recovery and more on long-term adoption.
Several factors could contribute to higher prices:
- Increased tokenization of real-world assets.
- Greater institutional blockchain adoption.
- Expansion of decentralized finance.
- Growth in blockchain gaming.
- Continued developer activity.
If these trends continue, AVAX could establish itself as one of the stronger-performing Layer 1 assets.
Overall Outlook: Bullish
AVAX Price Prediction for 2029
Expected Range
$15–$32
By 2029, Avalanche's success will depend less on short-term speculation and more on measurable network growth.
Investors will likely monitor:
- Active wallet growth.
- Daily transaction volume.
- Total Value Locked (TVL).
- Validator participation.
- Enterprise partnerships.
If these metrics continue improving, AVAX could experience another period of sustained growth.
However, competition among Layer 1 blockchains is expected to remain intense.
Projects that fail to innovate often lose market share over time.
Overall Outlook: Moderately Bullish
AVAX Price Prediction for 2030
Expected Range
$18–$45
Predicting cryptocurrency prices several years into the future involves significant uncertainty. Rather than focusing on a single target, it is more realistic to consider a range of possible outcomes.
Conservative Scenario
If Avalanche continues growing slowly while facing strong competition and moderate market conditions, AVAX could trade around $18–$25 by 2030.
Base Case Scenario
If the network experiences steady adoption, stronger developer activity, and favorable market conditions, a range between $30 and $35 becomes more realistic.
Bullish Scenario
If Avalanche becomes one of the dominant smart contract platforms with widespread institutional adoption and the cryptocurrency market enters another major bull cycle, AVAX could potentially reach $40–$45.
Even under this optimistic scenario, investors should remember that cryptocurrency markets remain highly volatile, and long-term forecasts become less certain over time.
What Could Drive AVAX Higher by 2030?
Several long-term factors could positively influence Avalanche's future value.
Continued Ecosystem Growth
A larger ecosystem of decentralized applications, developers, and users generally increases demand for the native token.
Institutional Adoption
Financial institutions exploring blockchain infrastructure could increase demand for scalable Layer 1 networks like Avalanche.
DeFi Expansion
More decentralized exchanges, lending protocols, and financial applications built on Avalanche could strengthen long-term network activity.
Real-World Asset Tokenization
One of the fastest-growing areas in blockchain is the tokenization of real-world assets, including real estate, bonds, and financial products.
If Avalanche captures a meaningful share of this market, demand for AVAX may increase over time.
Network Upgrades
Ongoing improvements to scalability, security, and developer tools can help Avalanche remain competitive as blockchain technology evolves.
What Could Hold AVAX Back?
Long-term investors should also consider the risks.
Strong Competition
Avalanche competes with many established blockchain networks.
Future competition may come from:
- Ethereum
- Solana
- BNB Chain
- Sui
- Aptos
- Future Layer 1 projects
Maintaining developer interest will remain critical.
Regulatory Challenges
Changes in cryptocurrency regulations could affect investor participation and overall market growth.
Market Cycles
The cryptocurrency market moves through bullish and bearish cycles.
Even fundamentally strong projects can experience significant corrections during market downturns.
Slower Adoption
If user growth slows or developer activity declines, demand for AVAX may weaken despite technological improvements.
Is AVAX a Good Long-Term Investment?
Avalanche continues to be one of the better-known Layer 1 blockchain projects, with a proven history of supporting decentralized applications, staking, and smart contracts.
From a technical perspective, the current charts suggest that AVAX is still recovering from a prolonged bearish trend rather than beginning a confirmed long-term bull market.
For investors with a long investment horizon, Avalanche may remain an interesting project to monitor because of its established ecosystem and ongoing development. However, as with any cryptocurrency, future performance will depend on both project-specific progress and the direction of the broader digital asset market.
Diversification, risk management, and regular portfolio reviews remain important when investing in volatile assets like AVAX.
Long-Term Forecast Summary
Our long-term outlook remains cautiously optimistic. The technical analysis shows that Avalanche is working to stabilize after an extended decline, while its long-term potential depends on continued ecosystem growth and broader market recovery.
The base-case forecast suggests AVAX could gradually recover toward the $30–$35 range by 2030 if adoption continues and market conditions remain favorable. More optimistic scenarios could see higher prices, while weaker adoption, increased competition, or prolonged bearish market conditions could keep AVAX below these targets.
Rather than focusing on a single price objective, investors should monitor key indicators such as network activity, trading volume, developer growth, and overall market sentiment to evaluate Avalanche's long-term progress.
Factors That Could Drive AVAX Higher
Although Avalanche is currently trading below its long-term moving averages, several developments could improve its outlook over the coming years.
1. Growth of the Avalanche Ecosystem
The long-term success of Avalanche depends on how many developers, businesses, and users build on its blockchain.
If more decentralized applications (dApps), NFT projects, blockchain games, and DeFi protocols launch on Avalanche, demand for AVAX could gradually increase.
Higher network activity often leads to:
- More transaction fees
- Increased staking
- Greater ecosystem value
- Stronger investor confidence
2. A New Crypto Bull Market
Historically, most altcoins perform well when Bitcoin enters a strong bull market.
If Bitcoin reaches new highs in future market cycles, capital often flows into large-cap altcoins such as Avalanche.
This could significantly improve AVAX's long-term price performance.
3. Institutional Adoption
More financial institutions are exploring blockchain technology for payments, tokenized assets, and decentralized finance.
If Avalanche secures additional enterprise partnerships, it could strengthen investor confidence and increase long-term adoption.
4. Network Upgrades
Technology continues to evolve quickly.
Future improvements in:
- Scalability
- Security
- Developer tools
- Cross-chain interoperability
could make Avalanche more attractive to developers and businesses.
5. Growing Staking Participation
AVAX holders can stake their tokens to help secure the network.
Higher staking participation reduces the amount of AVAX available for trading, which may support prices if demand continues increasing.
Risks Investors Should Watch
Every investment carries risk, and cryptocurrencies are especially volatile.
Understanding these risks helps investors make better decisions.
1. Bitcoin Dominance
Avalanche's price is closely linked to Bitcoin.
If Bitcoin experiences a sharp correction, AVAX could decline even if Avalanche's fundamentals remain strong.
2. Strong Competition
Avalanche competes against several major blockchain networks.
These include:
- Ethereum
- Solana
- BNB Chain
- Sui
- Aptos
- Emerging Layer 1 projects
If competing ecosystems grow faster, Avalanche could lose market share.
3. Regulatory Changes
Government regulations continue evolving worldwide.
New rules affecting cryptocurrency trading, staking, taxation, or decentralized finance could influence investor demand.
4. Market Volatility
Cryptocurrency prices can change dramatically within a short period.
Even strong projects regularly experience corrections of 30–70%.
Investors should always prepare for periods of high volatility.
5. Lower Network Growth
If developer activity slows or fewer users adopt Avalanche, demand for AVAX may remain limited.
Network growth remains one of the most important long-term indicators.
Is AVAX Still Worth Watching?
Despite the prolonged correction shown on the monthly and weekly charts, Avalanche remains one of the more established smart contract platforms in the cryptocurrency market.
The project continues to have:
- An active developer community
- A functioning DeFi ecosystem
- Fast transaction speeds
- Low transaction costs
- A well-known Layer 1 blockchain
However, technical analysis suggests patience is still appropriate.
The long-term trend has not yet fully reversed, and investors should continue monitoring:
- Higher highs
- Higher lows
- Weekly EMA recovery
- Increasing trading volume
- Stronger RSI momentum
These signals would provide greater confidence that AVAX is entering a new bullish cycle.
Frequently Asked Questions (FAQs)
What is Avalanche (AVAX)?
Avalanche is a Layer 1 blockchain that supports smart contracts, decentralized applications (dApps), NFTs, and DeFi services. Its native cryptocurrency, AVAX, is used for transaction fees, staking, and network security.
Is AVAX a good investment?
Avalanche has strong technology and an established ecosystem, but like all cryptocurrencies, it carries significant risk. Investors should consider their financial goals, risk tolerance, and conduct their own research before investing.
What is the AVAX price prediction for July 2026?
Based on the current technical analysis, AVAX is expected to trade between $6.30 and $7.20 during the remainder of July 2026, assuming market conditions remain stable.
Can AVAX recover in 2026?
Yes, a recovery is possible if Avalanche holds key support levels, Bitcoin remains strong, and buyers successfully reclaim important resistance zones. However, the long-term trend has not yet confirmed a full reversal.
What could push AVAX higher?
Potential catalysts include:
- A broader crypto bull market
- Increased network adoption
- Higher staking participation
- Institutional partnerships
- Growth in DeFi and blockchain gaming
Can AVAX reach $20 again?
According to our base-case long-term outlook, reaching $20 is possible over the next several years if Avalanche continues expanding its ecosystem and the broader cryptocurrency market remains favorable.
Can AVAX reach $50?
A move toward $50 would require significant long-term adoption, strong developer growth, sustained institutional interest, and another major cryptocurrency bull cycle. While not impossible, the current technical charts do not provide evidence for such a move in the near term.
What are the biggest risks for Avalanche?
The primary risks include:
- Competition from other Layer 1 blockchains
- Regulatory uncertainty
- Weak Bitcoin performance
- Lower developer activity
- Reduced investor demand
Is AVAX better for short-term trading or long-term investing?
It depends on the investor's strategy.
Short-term traders often focus on technical indicators and price action, while long-term investors typically evaluate ecosystem growth, adoption, and broader market trends.
What technical indicators are most useful for AVAX?
Some of the most commonly used indicators include:
- Relative Strength Index (RSI)
- MACD
- Exponential Moving Averages (EMA)
- Trading Volume
- Support and Resistance Levels
Using multiple indicators together generally provides a more balanced view than relying on a single signal.
Final Verdict
Avalanche remains one of the cryptocurrency market's most recognized Layer 1 blockchain projects, but its technical outlook continues to reflect a market in transition. The monthly and weekly charts show that the broader trend is still bearish, while the daily and 4-hour timeframes suggest selling pressure has eased and buyers are beginning to defend important support levels.
For the remainder of July 2026, the most likely scenario is continued consolidation with a slight bullish bias, provided AVAX remains above the $6.30–$6.60 support zone. A confirmed breakout above nearby resistance, supported by stronger trading volume, would improve the short-term outlook. Over the longer term, Avalanche's future performance will depend on ecosystem growth, developer activity, institutional adoption, and the direction of the broader cryptocurrency market.
Rather than focusing on ambitious price targets, investors should monitor key technical signals, network development, and overall market conditions. A disciplined, research-driven approach is likely to be more valuable than reacting to short-term price swings.